
Indian Child Height & Weight Chart by Age: Boys & Girls Growth Chart WHO Standard
Here’s what most parents don’t realize: that circle on the chart isn’t a diagnosis; it’s a starting point. HFA (Height-for-Age), WFA (Weight-for-Age), and WHZ (Weight-for-Height Z-score) each measure something different, and a child can fall short on one while being completely normal on the others.
That’s exactly why a single circled point on a paper chart rarely tells the full story; you need to see all three measurements together to know whether it’s something to watch or something to act on. Typing the same numbers into the Poshan Calculator gives you that full picture instantly, instead of leaving you to guess at what one circled dot actually meant.
Quick Answer:
The growth curve of height and weight tells you about the normal growth of your child according to his/her age and gender. As per WHO growth charts, Indian male and female children from 0-6 years old are classified through HFA, WFA, and WHZ and fall into categories such as Normal, MAM, SAM, underweight, stunting, or wasting.
What Is a Child Height & Weight Chart?
Height & weight graph of your child: It is an easy reference guide that lets you know how well your child’s growth is going. The height and weight of the child are compared with the WHO’s standard height and weight.
Here’s the thing: these charts aren’t just for doctors. Anganwadi workers use them every month during weighing days. School health checkups use them. And now, parents at home can use them too.
Every child grows differently. One child in your neighborhood might look bigger than yours at age 2. That doesn’t automatically mean your child has a problem. What matters is whether your child is following their own healthy growth curve over time.
I’ve spoken to many mothers who had no idea what the numbers on a growth chart even meant. They just knew their child looked “thin” or “short.” That worry is real and completely valid. But a chart gives you something more useful than a guess. It gives you a number you can actually track.
WHO Growth Standards: What They Mean for Indian Children
The WHO child growth standards have been created using the information of children in various countries, including India. They indicate how children would grow under optimal conditions that meet all their physical needs.
In India, the ICDS program also adopts the WHO child growth standards for the observation of the growth of children between birth and 6 years in Anganwadi centers.
When a child’s measurements fall below certain levels, they may be classified as:
Underweight: low weight for their age
Stunting: low height for their age, meaning slow long-term growth
Wasting: low weight for their height, meaning recent or rapid weight loss
MAM: Moderate Acute Malnutrition
SAM: Severe Acute Malnutrition
And this is where many parents get confused. These words sound very serious, and SAM and MAM do need medical attention. But not every low reading means an emergency. It means monitoring more carefully.
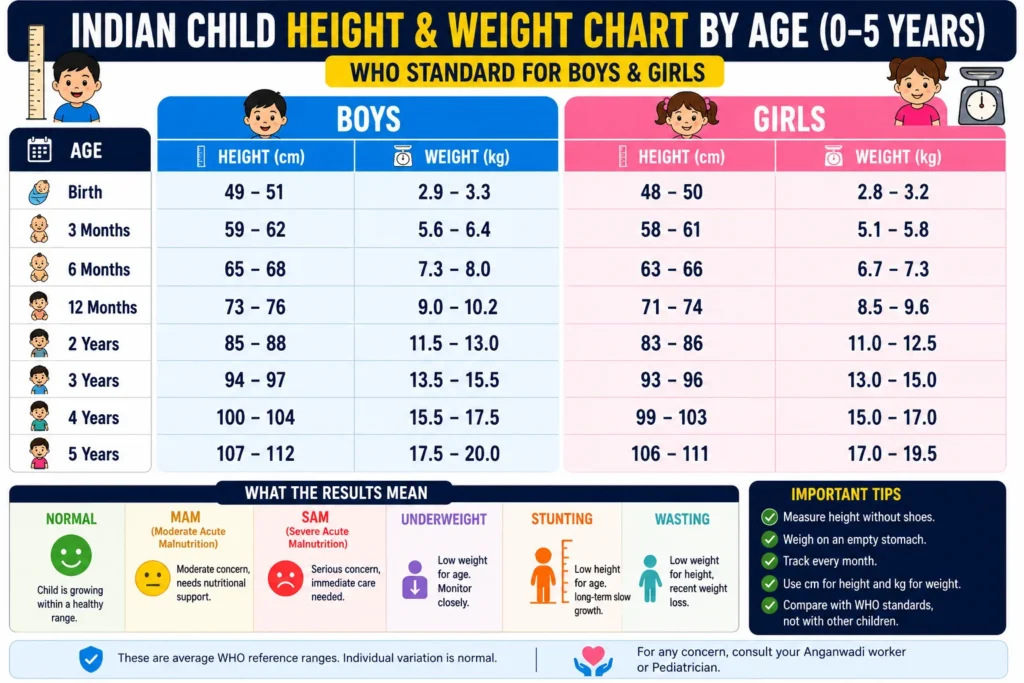
Height and Weight Chart by Age: Boys and Girls (0–5 Years)
Below are general WHO-based reference values. These are average ranges: your child may be slightly above or below and still be growing healthily.
| Age | Boys Height (cm) | Boys Weight (kg) | Girls Height (cm) | Girls Weight (kg) |
| Birth | 49–51 | 2.9–3.3 | 48–50 | 2.8–3.2 |
| 3 Months | 59–62 | 5.6–6.4 | 58–61 | 5.1–5.8 |
| 6 Months | 65–68 | 7.3–8.0 | 63–66 | 6.7–7.3 |
| 12 Months | 73–76 | 9.0–10.2 | 71–74 | 8.5–9.6 |
| 2 Years | 85–88 | 11.5–13.0 | 83–86 | 11.0–12.5 |
| 3 Years | 94–97 | 13.5–15.5 | 93–96 | 13.0–15.0 |
| 4 Years | 100–104 | 15.5–17.5 | 99–103 | 15.0–17.0 |
| 5 Years | 107–112 | 17.5–20.0 | 106–111 | 17.0–19.5 |
These are average WHO reference ranges. Individual variation is normal. Always confirm with your Anganwadi worker or pediatrician.
How to Use the Poshan Calculator to Track Your Child’s Growth
Checking a paper chart is one thing. But honestly? Most parents don’t know how to read those Z-score lines on a printed WHO chart. They look at it, feel more confused, and put it away.
That’s exactly why poshancalculatoronline.com built a free online tool that does the reading for you.
All you need is:
Your child’s age (in months or years)
Your child’s gender
Your child’s height (in cm)
Your child’s weight (in kg)
Enter these four values, and the calculator instantly shows you whether your child falls in the Normal, MAM, SAM, underweight, stunting, or wasting category based on WHO and ICDS standards.
No login. No app download. Works on any mobile phone, even with slow internet.
So if your child just came back from a weighing day and you want to double-check the result, or if you simply want to track growth at home between Anganwadi visits, this is the simplest way to do it.
Pro Tips for Accurate Measurement at Home
- Always measure height without shoes or hair clips
A small mistake in height can change the entire result. For toddlers under 2 years, measure lying down. For older children, measure standing straight against a wall. Even 1–2 cm matters when checking for stunting - Weigh your child on an empty stomach in the morning
Clothing, shoes, and even a full meal can add 0.5–1 kg to the reading. Weigh your child without heavy clothes and before breakfast for the most accurate number. - Track every month: not just on Anganwadi day
The timing matters. A lot, actually. One reading tells you where your child is today. Monthly readings tell you whether they are moving in the right direction. - Use cm, not inches or feet
The WHO growth chart and Poshan Calculator both use centimeters. Many parents enter height in feet by mistake. This gives a completely wrong result. Double-check before entering. - Do not compare your child with siblings or neighbors
Every child has their own growth pattern. Your first child being taller at age 3 does not mean your second child has a problem. Compare your child to the WHO standard, not to another child in your family.
Common Mistakes Indian Parents Make with Growth Charts
Guessing weight instead of measuring it
Many parents say “my child is around 10 kg” without actually weighing them. Even a half-kg difference can shift the result from Normal to MAM. Always use a weighing scale.
Checking once and forgetting
Growth tracking is not a one-time thing. A child can be Normal today and drop to MAM in 6–8 weeks if they go through a long illness, lose appetite, or face a bad monsoon season with infections. Monthly tracking is what catches these changes early.
Treating the calculator result as a final diagnosis
Our Poshan Calculator and any online tool are for awareness and early tracking only. If your child shows a yellow or red result, please speak to your Anganwadi worker, ASHA worker, or pediatrician. Do not start supplements or change the diet drastically based on an online result alone.
Ignoring a result because “the child looks fine”
Stunting low height for age doesn’t always look obvious. A child can look healthy and still be stunted from slow long-term growth. The chart catches what the eye misses.
Normal vs MAM vs SAM: Simple Comparison Table
| Category | What It Means | What To Do |
| Normal | The child is growing within a healthy range | Continue regular monthly tracking |
| MAM (Moderate Acute Malnutrition) | Moderate concern, the child needs nutritional support | Visit the Anganwadi worker, improve diet |
| SAM (Severe Acute Malnutrition) | Serious concern, immediate care needed | See a doctor or health center urgently |
| Underweight | Low weight for age | Monitor closely, speak to a professional |
| Stunting | Low height for age, long-term slow growth | Consistent nutrition and medical follow-up |
| Wasting | Low weight for height, recent weight loss | Urgent nutrition attention and a doctor visit |