
Poshan Calculator vs Manual Growth Charts: Why Digital Wins Every Single Time
Poshan Calculator vs Manual Growth Charts: That evening, I finally understood why “lower side” had left me with more questions than answers. A manual growth chart depends entirely on who’s reading it, how tired they are, and how much time they have between the twelfth mother in line and the next one. There’s no room for nuance, just a quick glance and a general impression. When I ran Aanya’s numbers through Poshan Calculator Online instead, it didn’t just place her on a line; it told me exactly where she stood, in terms I could actually act on, without needing anyone to explain it to me twice.
I’m not angry about it. She had a waiting room full of mothers behind me.
Quick Answer:
The Poshan Calculator is a free browser-based tool that checks your child’s nutritional status using WHO and ICDS growth standards in under a minute, on any smartphone, with no account or download needed. Compared to manual paper charts, it removes human error, gives results anyone can understand, and works even on basic 2G internet. You get an actual answer, not an estimate.
What the Poshan Calculator Actually Does
Every website about this tool leads with the same paragraph. Poshan Abhiyaan. WHO standards. ICDS benchmarks. Fine, all true. But let me tell you what it does when you actually sit down and use it.
You type in three things: your child’s age, height, and weight. The tool checks those numbers against the WHO Child Growth Standards and gives you a color-coded result in plain language. It measures weight for age, height for age, and weight for height simultaneously.
That last part matters more than most parents realize. A child can look fine by weight alone and still be stunted at a low height for age from long-term undernutrition that happened quietly over months. If you only check the weight, you miss it. The Poshan Calculator doesn’t let you check only one thing.
What stunting means in child nutrition and why it matters more than weight alone
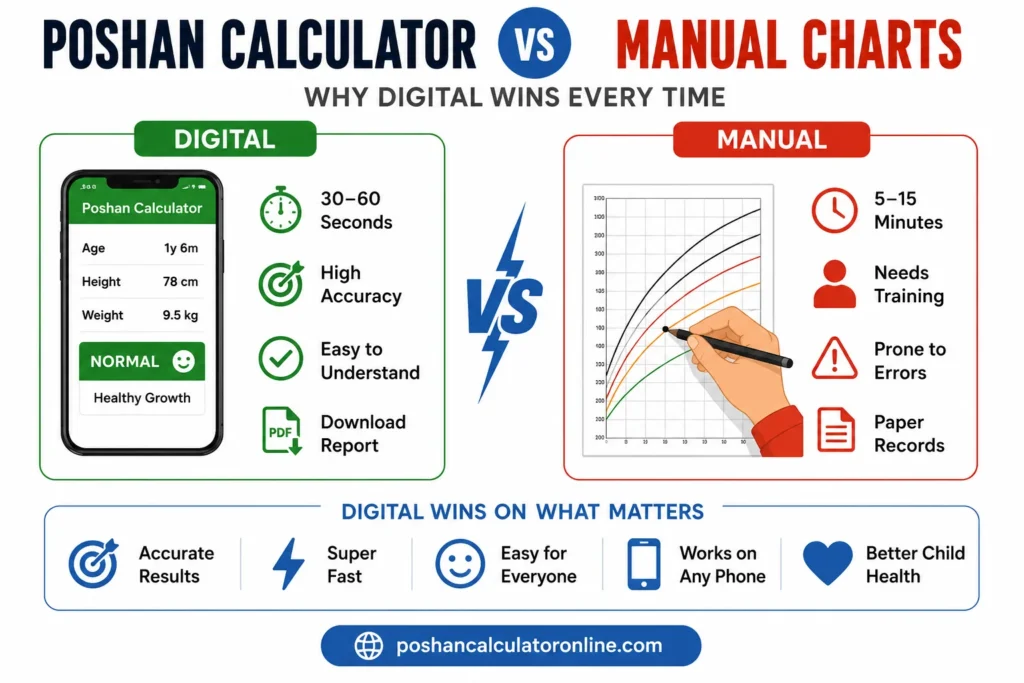
The Reality of Manual Growth Charts on the Ground
I have genuine respect for Anganwadi workers. They do difficult, important work in conditions most people never see firsthand. But the manual chart process has problems that are structural, not personal.
Here’s what a field visit actually looks like near the end of a long day. The worker has measured twenty-plus children already. She has a printed WHO reference sheet, the kind that gets photocopied from a photocopy until the numbers are slightly blurry. She plots your child’s measurement as a dot on a tiny graph, cross-references it against age-specific lines, and classifies the result. All while your toddler is trying to escape, and five other women are waiting outside.
Five manual steps. Five places where a small error enters silently.
A nutrition assessment from Jharkhand found misclassification in manual chart systems running between 15 and 20 percent across field assessments. Roughly one in five children gets the wrong category. Not because anyone is incompetent, but humans doing repetitive manual tasks under pressure make errors, and the system wasn’t designed to catch them. That number changed how I thought about relying only on what the register says.
Side by Side: What Actually Differs
| What You’re Comparing | Poshan Calculator Online | Manual Growth Chart |
|---|---|---|
| Time per child | 30 to 60 seconds | 5 to 15 minutes |
| Who can read the result | Anyone: no training needed | Requires specific training |
| Accuracy | Automated WHO algorithm | Depends on training, fatigue, eyesight |
| Result clarity | Color-coded, plain language | A dot on a graph needing interpretation |
| Record keeping | Download PDF in one tap | Paper register: easily lost or damaged |
| Cost | Completely free | Printing and distribution costs |
One honest exception: zero connectivity. A paper chart still works when a browser won’t load. Outside that, digital wins on every metric that matters.
How to Use It for the First Time
The first time I used poshancalculatoronline.com, I expected more steps, something to figure out. There wasn’t.
Open any browser on your phone. Go to poshancalculatoronline.com. No download, no account screen, no sign-up form.
Select your child’s gender. Boys and girls use different WHO growth curves; this changes your result.
Enter age in years and months both. Not just “2 years.” If your daughter is 2 years and 7 months, enter both. For children under two, a single month off can shift a borderline result.
Enter height in centimeters. Children under two measure lying flat. Over two standing straight, no shoes, heels touching a wall.
Enter weight in kilograms. Remove shoes and heavy clothing first. 700 grams of extra clothing can push a borderline child into the normal range on screen and hide a real problem.
Click Show Results. Nutritional status appears immediately. Download the PDF to keep a record.
Forty to ninety seconds. Less time than the hold music when you call a government helpline.
Reading Your Results Without Panicking
Green: Normal. Height and weight are where they should be. Keep the same feeding routine and check again in four to six weeks.
Yellow: MAM (Moderate Acute Malnutrition). A warning, not a crisis, but action this week, not “at some point.” Increase meal frequency, add calorie-dense foods. Visit your Anganwadi center soon. Don’t wait to see if it improves on its own, because with nutrition, it usually doesn’t.
Red: SAM (Severe Acute Malnutrition). I’m not going to soften this. SAM affects brain development and immune function in ways that can have permanent consequences. A better diet at home is not enough. Your child needs to see a doctor today.
Orange: Overweight. More common in cities than people expect. Visit a nutrition counselor to understand what’s driving the imbalance.
Errors Nobody Warns You About
Entering height in inches instead of centimeters
If your child is 91 centimeters and you type 36 their height in inches, the calculator reads 36 centimeters, shorter than a newborn. The result will be completely wrong. Always use centimeters.
Not removing clothing before weighing
Shoes plus a heavy sweater can add over a kilogram, enough to push a genuinely underweight child into the normal range on screen.
Rounding the age
“Almost 4” entered as 48 months when the child is 43 months is a five-month error. Enter actual months, not the nearest round number.
Letting the child slouch during height measurement
Heels and back against a wall, chin parallel to the floor. Even 2 centimeters from poor posture can shift a borderline result into the wrong category.
Real Questions, Straight Answers
Final Thoughts about Poshan Calculator vs Manual Growth Charts
I think about that parking lot moment more than I probably should.
Not because the result was dramatic, but because Aanya was fine. But for eight months, I had been operating on “probably fine” and “she looks healthy to me.” That isn’t information. They’re just the absence of bad news.